On a Tuesday in 2025, a magnitude 8.8 earthquake ruptured the seafloor off Russia’s Kamchatka Peninsula and sent a tsunami racing across the entire Pacific Ocean at roughly 800 kilometers per hour — the speed of a commercial jet. For the first time in history, a satellite watched the wave propagate in high-resolution, wide-swath detail across an open ocean basin, and what it recorded did not match the textbooks.
The wave nobody saw coming — until a satellite did
NASA’s SWOT (Surface Water and Ocean Topography) satellite captured what scientists at NASA’s Jet Propulsion Laboratory are describing as the world’s first high-resolution, wide-swath measurement of a major tsunami crossing an ocean basin. According to NASA, the satellite recorded the tsunami spawned by the Kamchatka earthquake and revealed wave behavior that no existing propagation model had predicted. The discovery is scientifically significant on two levels: it exposed a rupture zone substantially larger than seismic models alone had estimated, and it showed that the tsunami’s internal structure was far messier than the clean, orderly pattern that standard forecasting tools assume.
The deeper irony at the center of this story is that SWOT was never built to watch tsunamis. It was designed for rivers, lakes, and the broad texture of the sea surface. The fact that it captured a major transoceanic tsunami at all was, in the words of researchers involved in the analysis, a matter of orbital timing — the satellite happened to be passing over the relevant stretch of the Pacific at the precise window when the tsunami’s signature was still readable on the open ocean. That fortunate accident has since become a scientific and policy argument for redesigning how the world monitors one of its most dangerous natural hazards.
What SWOT is — and what it was actually built to do
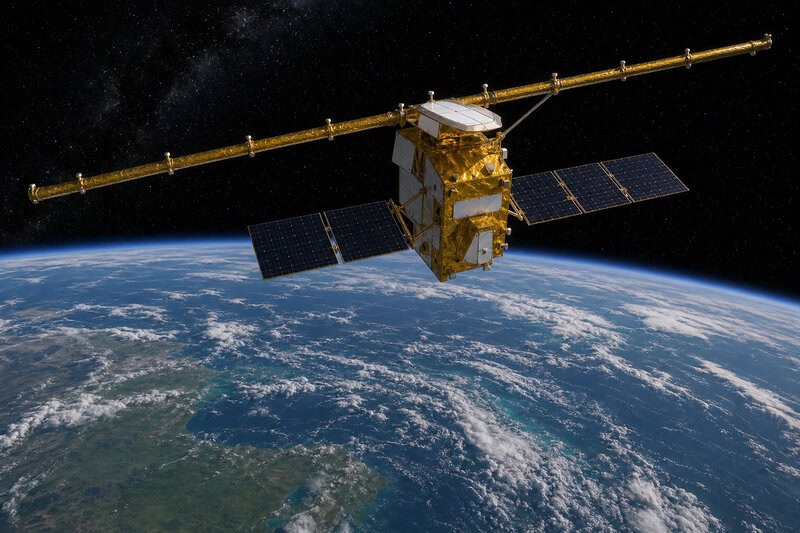
SWOT is a joint mission operated by NASA and the French space agency CNES, launched in December 2022. Its primary mandate is to measure the height of Earth’s surface water — rivers, lakes, reservoirs, and the fine-grained texture of the global ocean — with centimeter-scale precision across a 120-kilometer-wide swath. That combination of precision and coverage width is what makes the satellite unusual among Earth-observing instruments.
Its core instrument, the Ka-band Radar Interferometer (KaRIn), bounces radar pulses off the water surface from two antennas separated by a 10-meter boom. The slight difference in the return time of each antenna’s echo encodes the precise height of the water surface below — a technique called interferometric synthetic aperture radar (SAR) that is well established in land mapping but was novel for ocean-wide water-height measurement at this resolution. The result is sensitivity fine enough to detect sea-surface height variations of roughly one centimeter across features hundreds of kilometers wide, a capability several orders of magnitude finer than older, single-track radar altimetry satellites.
SWOT was engineered for hydrology and large-scale oceanography — tracking how freshwater moves through river systems, how ocean eddies redistribute heat, and how sea levels are changing over time. Tsunami science was not part of the mission brief. The Kamchatka event did not change that mission; it revealed an unplanned capability hiding inside it.
How tsunamis are — and are not — detected from space
A tsunami in the open ocean is nearly invisible to the naked eye and to most instruments. In deep water, the wave may be less than half a meter tall while stretching hundreds of kilometers from crest to crest. That extreme length-to-height ratio is what allows the wave to travel so fast without being felt by ships — but it also makes the wave theoretically detectable as a subtle sea-surface height anomaly from orbit, provided the observing instrument has sufficient resolution and areal coverage.
Before SWOT, the most instructive example of satellite tsunami detection came from the 2004 Indian Ocean disaster, which was partially measured by the Jason-1 satellite using a conventional single-beam radar altimeter. That instrument recorded sea-surface height along one narrow ground track — producing a one-dimensional slice of the ocean — and the data arrived after the disaster had already struck coastlines. It was scientifically valuable but operationally too late and geometrically too thin to reveal the wave’s full spatial structure.
SWOT’s wide-swath design changes the geometry entirely. Instead of a single track, the satellite captures a broad two-dimensional image of sea-surface height, allowing scientists to see the tsunami’s full spatial structure — its crests, troughs, and interference patterns — rather than inferring it from a sparse line of data points. The historical limitation of satellite-based tsunami science has always been the mismatch between orbital timing and tsunami propagation speed; SWOT’s wider field of view dramatically improves the probability of capturing a tsunami while it is still in motion across deep water.
What the satellite actually saw — and why it was surprising
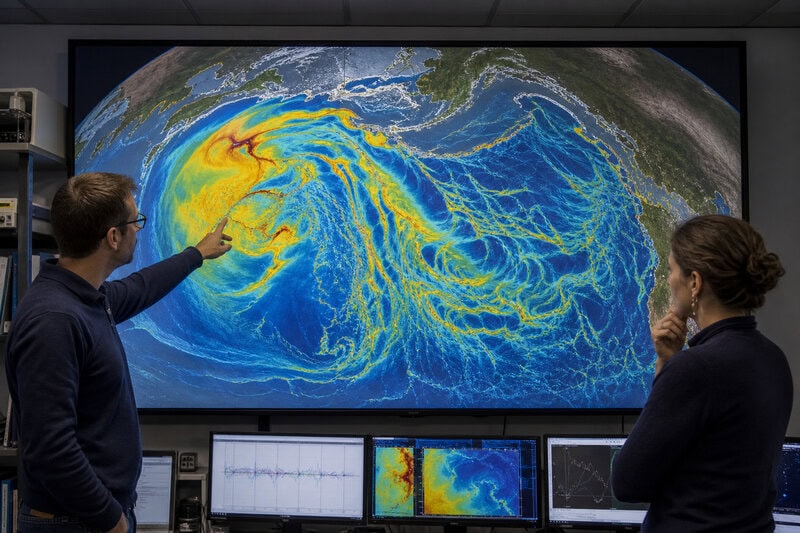
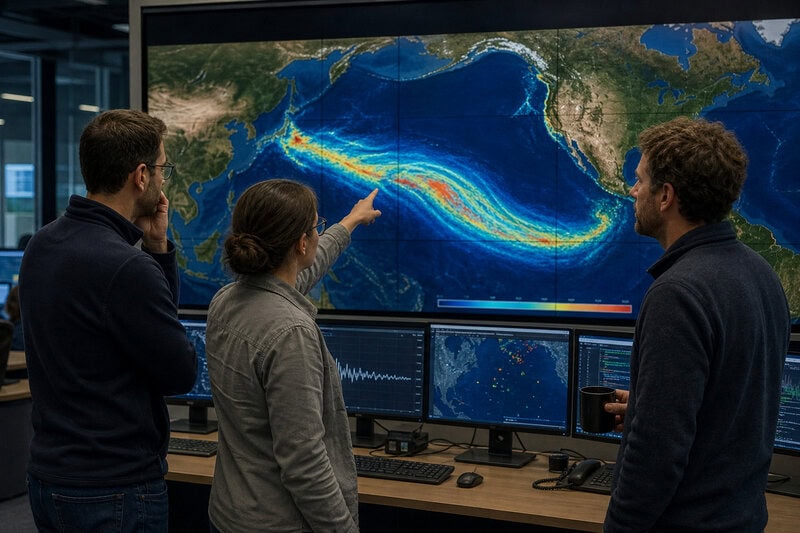
When researchers processed the SWOT data from the Kamchatka event, the tsunami’s wave structure was far more complex than standard propagation models forecast. Instead of a clean, orderly series of parallel wave fronts spreading outward from the source region, the satellite revealed a chaotic, multi-directional interference pattern — waves overlapping, refracting, and interacting with underwater topography in ways that existing models had smoothed over or ignored entirely.
This finding directly challenges one of the foundational assumptions in tsunami science: that a tsunami’s energy spreads outward from its source in a relatively predictable, radially symmetric pattern that computational models can accurately replicate. The SWOT data suggests the real picture is messier and more spatially localized than that assumption allows — and this matters practically. The concentration of wave energy determines which specific stretches of distant coastline receive the most dangerous surge. If models are systematically smoothing over that complexity, hazard estimates for particular communities could be wrong in ways that are impossible to detect without wide-area spatial observations of this kind.
Perhaps most consequentially, the sea-surface height measurements allowed scientists to work backward through the physics and reconstruct the earthquake’s rupture geometry. The resulting estimate of the rupture zone was substantially larger than what seismological models alone had produced — meaning that seismic analysis alone had been underestimating the earthquake’s true size and the energy it transferred to the ocean.
It is important to be precise about the scientific status of these findings. The complex wave-structure result is an emerging conclusion, not settled science. Researchers involved in the study have described it as a call to revisit tsunami propagation theory rather than a definitive revision of it. The observations open questions more than they close them, and independent replication using different analytical methods is the necessary next step before these conclusions can be considered established.
The science of reading an ocean from 890 kilometers up

SWOT orbits at approximately 890 kilometers altitude and completes a global coverage cycle — imaging every point on Earth’s surface between 78 degrees north and south latitude — roughly every 21 days. Its wide swath means that any given ocean region can be observed more than once per cycle depending on orbital geometry, but coverage is not continuous in the way a geostationary weather satellite provides.
Separating a tsunami signal — which may raise sea-surface height by 20 to 50 centimeters in deep water — from the background noise of ordinary ocean swells, tides, and atmospheric pressure effects requires sophisticated filtering algorithms. The Kamchatka event gave scientists a real-world stress test of those methods against a known, well-documented event, with independent seismic and buoy data available for comparison. That the tsunami signature was recoverable at all under operational conditions is itself a meaningful validation of the filtering approach.
The interpretation also benefited from data already collected by the DART (Deep-ocean Assessment and Reporting of Tsunamis) buoy network — a global array of seafloor pressure sensors and surface buoys that detect passing tsunamis at fixed points. The SWOT observation was cross-checked against DART readings from the Kamchatka event, allowing researchers to validate the satellite’s measurements against independent ground-truth data and build confidence in the result.
Why this changes tsunami early-warning science — and what it cannot yet do
Current tsunami early-warning systems rely primarily on seismometers to estimate earthquake magnitude and location, supplemented by DART buoys at fixed ocean positions. Neither system can show scientists where within an ocean basin tsunami wave energy is concentrated at any given moment during propagation. A satellite capable of imaging the tsunami’s full two-dimensional structure while it is still in deep water could, in principle, feed that spatial information into forecast models and sharpen predictions of coastal impact — identifying which specific stretches of coastline face the highest energy surge before the wave arrives.
The caveat is significant and must be stated plainly: SWOT’s 21-day repeat cycle and the inherently unpredictable timing of large earthquakes mean that opportunistic captures like the Kamchatka event are rare. Scientists are explicit that the current satellite is not a tsunami early-warning system. It is a scientific proof of concept — a demonstration that the measurement is achievable and that the data it produces contains information that existing warning infrastructure cannot provide.
Researchers involved in the study have argued that the findings make a compelling case for designing future satellites with tsunami monitoring as an explicit mission requirement — either a dedicated constellation of wide-swath altimetry satellites or the inclusion of similar instruments on future operational oceanography missions. That is a long-term policy and engineering argument, not a near-term operational fix, and no such mission has been formally approved.
What comes next — and what remains unknown
The Kamchatka observation has been submitted for peer review and the full dataset has been made available to the broader oceanographic community. Independent researchers can now test whether the complex wave-structure findings hold up under different analytical approaches — a critical step before the results can be considered established science rather than a single team’s interpretation of a novel dataset.
Key open questions remain. How much of the unexpected structural complexity reflects a real physical feature of tsunami propagation versus an artifact of SWOT’s measurement geometry or the filtering methods applied to the data? Does the revised rupture-size estimate change long-term hazard assessments for the Kamchatka subduction zone, one of the most seismically active regions on Earth? And would similar complexity appear if researchers applied equivalent analysis to the handful of other tsunamis for which partial satellite data already exists?
NASA and CNES have indicated that the SWOT mission, funded through at least the late 2020s, will continue to monitor the global ocean surface. The science team is now developing automated detection algorithms specifically designed to flag tsunami signatures in real time as satellite data is downlinked — an effort to convert an accidental discovery into an intentional, repeatable operational capability.
For decades, scientists have studied tsunamis almost entirely from their endpoints — the destruction they cause at shore — and from the thin lines of data that buoys draw through a vast ocean. SWOT showed, for the first time, what a major tsunami actually looks like in full spatial motion across an ocean basin. The picture is simultaneously more complicated and more knowable than the models assumed. That is not a comfortable finding for hazard forecasters, but it is an honest one — and honesty about complexity is where better science, and ultimately better warnings, must begin.