Heat waves occupy just 12 to 15 percent of warm-season days — yet new peer-reviewed research finds that 42 percent of all area burned by wildfires occurs during or immediately after one. That gap between time occupied and destruction caused is not a rounding error or a modeling artifact. It is a documented statistical multiplier — and closing the distance between what scientists now know about it and what emergency managers, policymakers, and the public act on may be one of the more consequential tasks in applied climate science right now.
The Raw Numbers Demand an Explanation
Start with the arithmetic. If heat waves were simply hotter versions of ordinary summer days, their share of total burned area should approximate their share of warm-season time — somewhere around 12 to 15 percent. Instead, they account for more than triple that proportion of landscape-level fire destruction. On any given day inside a heat wave, the area consumed by fire runs more than 50 percent larger than on a comparable non-heat-wave day. That figure comes from observed fire records, not from forward-looking climate projections, which means it is a statement about the world as it already exists — not a warning about some hypothetical future.
Two questions follow immediately. First, how do researchers isolate the heat-wave signal from the broader noise of seasonal warmth, regional drought, and land-use change? Second, what physical mechanisms actually translate extreme heat into disproportionate fire scale? Both questions have answers, and both answers have direct practical implications.
Why the Definition of a Heat Wave Matters More Than It Sounds
A heat wave, defined precisely, is a period of abnormally hot weather lasting at least two to three consecutive days above regionally defined temperature thresholds. The exact threshold varies by geography — what constitutes a heat wave in Oslo is not the same as in Phoenix — but fire-risk researchers standardize definitions across regions to enable meaningful cross-regional comparison and to prevent the label from meaning different things in different datasets.
That definitional precision is not academic formalism. Wildfire models that lump heat-wave days together with ordinary hot days systematically underestimate peak fire danger, because the compounding effects of consecutive extreme-heat days are non-linear. The second and third days of a heat wave do not simply add to the first; they amplify it. Soil that was merely warm on day one is critically depleted of moisture by day three. Vegetation that was stressed on day one is approaching tinder-dry conditions by the time the heat wave reaches its peak.
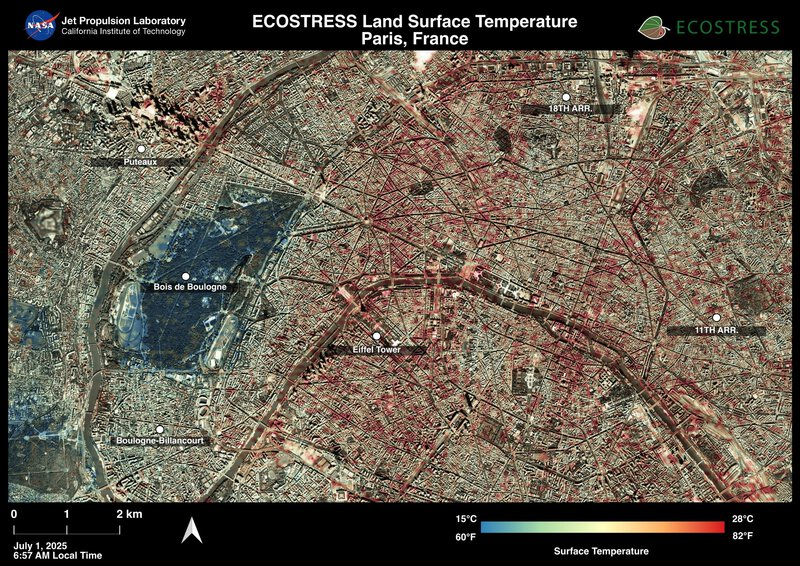
Researchers are equally careful to distinguish heat waves from the broader background warming trend that climate change is producing across all seasons. The heat-wave signal they are measuring sits on top of that trend — it is an episodic extreme embedded within a shifting baseline, not a synonym for “it is getting hotter generally.” That distinction matters for attributing fire risk accurately, and it matters for policy. Public-health and fire-science institutions increasingly call for treating heat waves as a distinct, high-priority climate hazard rather than an extension of normal summer weather — not least because heat waves drive excess human mortality independently of any fire they help ignite.
Three Mechanisms That Explain the Multiplier
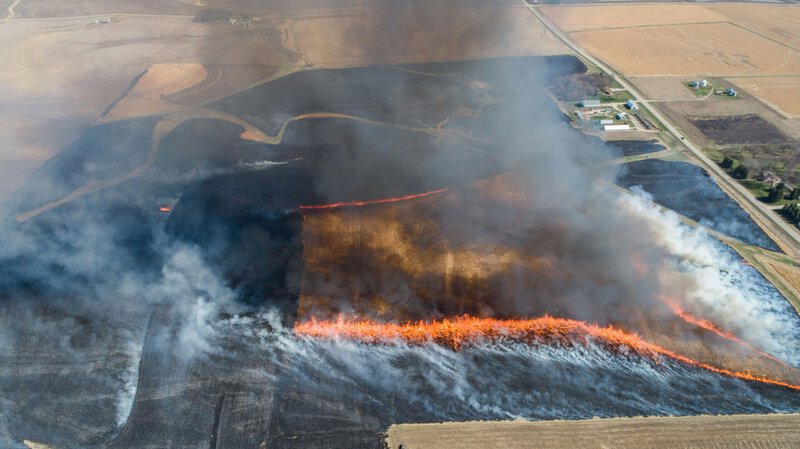
The primary pathway from extreme heat to wildfire is vegetation drying. Prolonged temperatures well above seasonal norms rapidly desiccate grasses, shrubs, and accumulated organic litter on the forest floor, stripping moisture from living biomass and converting it into the dry, continuous fuel that fire needs to spread explosively. A plant that retains roughly 80 percent moisture content under normal summer conditions may fall to 40 percent or lower during a multi-day heat wave — crossing thresholds at which ignition becomes far easier and spread far faster.
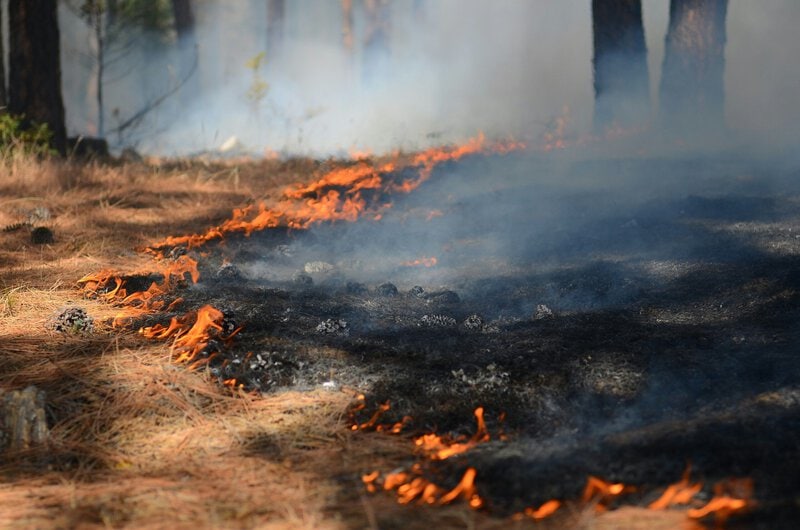
The second mechanism operates above the landscape rather than within it. Heat waves intensify and destabilize atmospheric conditions, generating erratic, gusty wind patterns and driving relative humidity to critically low levels. Both factors make active fire behavior more extreme and containment dramatically more difficult for ground crews and aerial resources. A fire burning in calm, moderately humid air and the same fire burning in low-humidity, gusty conditions are operationally different emergencies — and heat waves reliably produce the more dangerous set of conditions.
The third mechanism explains why elevated fire risk persists after a heat wave ends rather than dissipating with the heat itself. Consecutive extreme-heat days draw down deep soil-moisture reserves that take weeks or months to recharge. Even after temperatures moderate, the landscape remains primed: vegetation cannot rehydrate quickly, and structural vulnerability to ignition persists well beyond the meteorological event. Researchers treat these as three distinct, measurable pathways rather than a single monolithic “heat effect” — and that granularity is precisely what allows fire-danger forecasting models to be built with genuine predictive accuracy rather than rough approximation.
How the Study Was Built — and What It Can and Cannot Establish

The 42 percent and 50 percent figures come from a methodology designed to isolate the heat-wave signal from background fire-season conditions. Researchers cross-referenced historical fire records — tracking burned area across warm-season periods — with meteorological heat-wave indices, then compared burned-area distributions on heat-wave days against burned-area distributions on non-heat-wave warm days, controlling for regional and seasonal baselines. The approach is straightforward in principle and demanding in execution: it requires large, consistent datasets spanning multiple fire environments and multiple decades.
The geographic breadth of the data is itself a source of confidence. Patterns that hold across diverse fire environments — Mediterranean shrubland, boreal forest, temperate grassland — are less likely to reflect regional quirks than to reflect universal physical processes. When the same multiplier effect appears in ecosystems with different vegetation types, different ignition histories, and different suppression regimes, the underlying driver is almost certainly physical rather than local.
What the study design can and cannot establish is worth stating plainly, as the researchers themselves do. It demonstrates a robust statistical association between heat-wave conditions and elevated burned area, and it proposes mechanistic explanations grounded in established fire-weather physics. What it cannot do on its own is attribute every individual fire event to a heat wave — that requires a separate branch of attribution science that assigns probabilistic causal weight to specific climatic conditions for specific events. Drawing that distinction is the kind of epistemic discipline that separates rigorous fire science from overstatement, and it matters for how the findings should be used in practice.
Climate Change as the Multiplier’s Multiplier

The trajectory of climate change transforms a statistical finding about current conditions into a projection problem with serious near-term consequences. As global average temperatures rise, heat waves are projected to become more frequent, longer in duration, and more intense — each dimension independently increasing the probability that a heat wave will overlap with peak fire-season conditions, peak fuel dryness, and peak ignition activity from lightning or human sources.
The compounding logic is worth stating explicitly. If heat waves currently represent 12 to 15 percent of warm-season days and already account for 42 percent of burned area, a modest increase in heat-wave frequency — from 13 percent of warm-season days to 20 percent, for example — would not produce a proportional seven-percentage-point increase in burned area. It would produce a disproportionately larger increase, because the multiplier effect compounds on itself. More heat-wave days means more days at which the 50-percent-larger daily burn rate applies, and a larger share of the warm season spent in the high-risk condition.
This finding sits within an established scientific consensus. The Intergovernmental Panel on Climate Change and leading fire-science institutions have documented that human-caused warming is already increasing fire weather in most fire-prone regions worldwide. The research described here does not introduce a contested claim; it quantifies a specific mechanism — the heat-wave multiplier — within a trend that is not itself in serious scientific dispute. What remains genuinely uncertain, and what represents active scientific debate, is the degree to which fire suppression improvements, prescribed burning programs, land management interventions, and regional vegetation shifts will offset or amplify the heat-wave fire-risk signal in specific geographies. Those are not settled questions, and the researchers say so.
This Is Not Only a Wilderness Problem
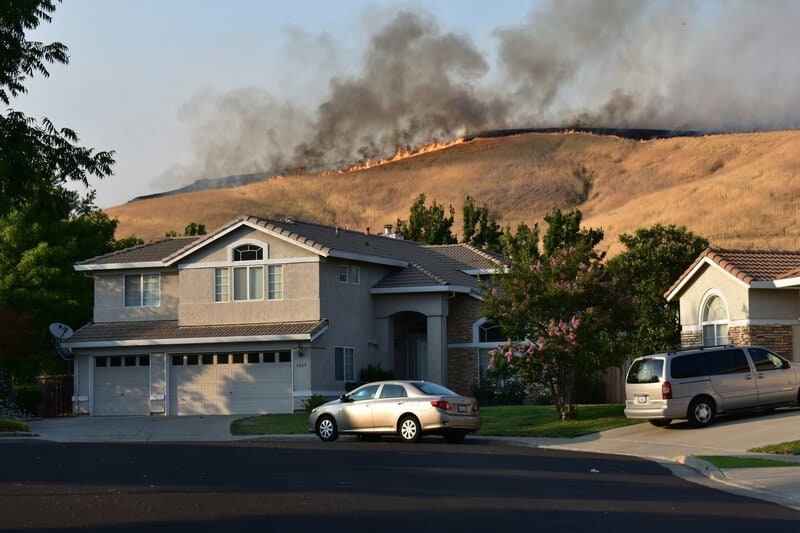
The communities where heat-wave-driven fire acceleration most directly threatens human life are wildland-urban interface zones — the sprawling areas where suburban and exurban development meets fire-prone vegetation. These include large portions of California’s foothills, communities across the American Southwest, and expanding suburban developments in southern Europe and southeastern Australia. In these zones, a 50-percent-larger daily burn footprint is not an abstraction about landscape ecology. It is a direct threat to structures, evacuation routes, and the people who live there.
The compounding nature of heat waves makes the operational challenge worse. The same extreme heat that primes vegetation for burning simultaneously stresses power grids, degrades air quality through increased ozone formation, and raises the rate of heat-related illness requiring emergency medical response. Fire agencies, public utilities, and emergency medical services face simultaneous, mutually reinforcing demands during heat waves — precisely when fire threat is peaking. A 50-percent-larger expected burn footprint has direct consequences for where agencies pre-position air tankers, at what thresholds evacuation orders are issued, and how much suppression capacity is held in reserve versus committed to active incidents.
The equity dimensions are increasingly documented as well. Lower-income communities, outdoor agricultural workers, and households without access to air conditioning face elevated combined exposure to both heat-mortality risk and wildfire smoke — a dual burden that wealthier populations are more able to avoid through mobility, housing quality, and access to medical care. The heat-wave wildfire risk equation is not distributed evenly across society, and resource allocation decisions that ignore that asymmetry will systematically under-protect the most exposed populations.
What Needs to Change — and What Remains Unresolved
The core takeaway of this research can be stated in a single sentence: heat waves are not merely correlated with larger wildfires — they occupy a mechanistically central role in fire ignition, spread, and scale that is now statistically documented at landscape level across diverse fire environments globally.
Translating that finding into operational practice is the immediate next step. Current fire-danger indices incorporate temperature, humidity, wind, and fuel moisture — but integrating real-time heat-wave detection as a distinct categorical input, one that triggers a step-change in warning levels rather than a linear adjustment, would more accurately reflect the non-linear risk that the 42 percent statistic represents. The 12 to 15 percent of warm-season days that carry 42 percent of the fire-season risk should, in principle, receive correspondingly elevated public warning levels and pre-positioned resource capacity. That alignment does not yet exist uniformly across fire management systems.
What the study does not resolve — and what will require targeted field experiments and higher-resolution modeling — is the relative weight of each identified mechanism across different ecosystems. How much of the elevated burned area during heat waves is driven by vegetation drying, how much by atmospheric destabilization, and how much by the persisting soil-moisture deficit? Those proportions likely differ substantially between a California chaparral landscape and a Canadian boreal forest, and knowing them matters for building ecosystem-specific forecasting tools that are genuinely useful rather than generically accurate.
The mathematical relationship between heat waves and wildfire scale, now documented in the peer-reviewed record, gives policymakers something concrete: a quantified reason — not just a qualitative concern — to treat heat-wave forecasting and wildfire preparedness as a single integrated emergency-management challenge. The numbers make a case that is difficult to dismiss. These are not two separate problems that sometimes coincide. They are, in a measurable and mechanistically grounded sense, one problem — and managing them separately is already costing more than the alternative.